Let’s us look at some ways of converting a color image into a black and white or gray scale image.
The most straight forward approach is averaging the three color channels, RGB.
GrayValue = (Red + Green + Blue) / 3
You do this for every pixel.
It is quick and dirty. And produces an ok grayscale image. And for what we are doing with the images it will work for computer processing.
However, something to be aware of – the human eye does not see like computers. Due to cone density in the human eye is not uniform across colors. Humans perceive green more strongly than red, and red more strongly than blue.
If you were doing a gray scale conversion for the enjoyment of humans, and wanted something more eye pleasing – you would need to look into doing a weighted gray scale conversion.
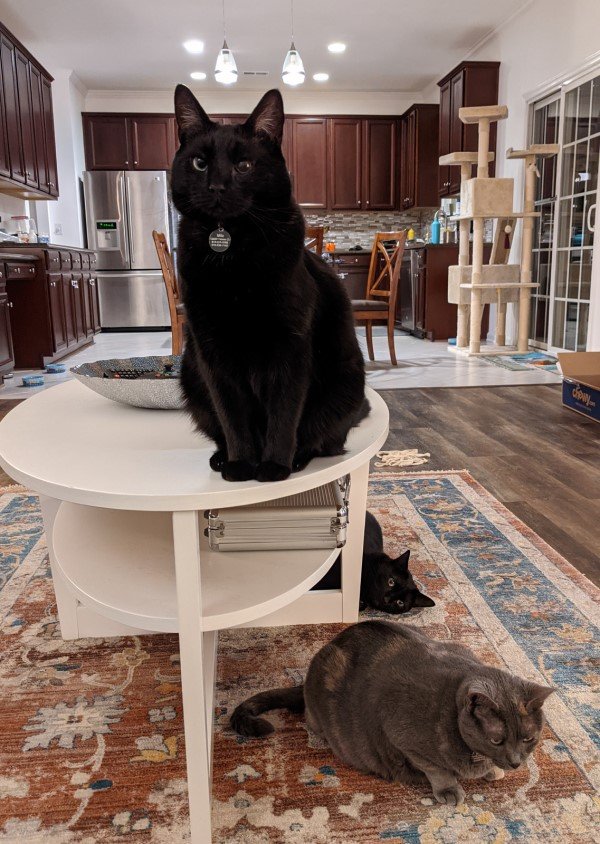
Here is the python code that will load am image – like the one below in color and then convert it using averaging to gray scale.
There are python modules already out there that will do this – however we are more interested in how it is done, not some black box thing.

#%%
from PIL import Image
import numpy as np
import matplotlib.pyplot as plt

# Image File we are loading
imageFile = r"D:\temp\thecats.jpg"

# Pillow Image Object
inputImage = Image.open(imageFile)

# Convert To Numpy Array
imageArray = np.array(inputImage)

#%%
# From the Array get the Image(array) size
imageHeight = imageArray.shape[0]
imageWidth = imageArray.shape[1]

# Create Empty Array to store the gray scale image
imageArrayGrayScale = np.empty([0,imageWidth], dtype=np.uint8)

# Set the counters so we can move through the array
imageHeightCurrentPosition = 0
imageWidthCurrentPosition = 0

# Go into the Array, and for each row, extract the data out
while imageHeightCurrentPosition < imageHeight:
    # Create Empty list to hold the new gray scale row data
    imageRowList = []

    # For each column, extract the RGB values for each dimension.
    while imageWidthCurrentPosition < imageWidth:
        redValue = int(imageArray[imageHeightCurrentPosition,imageWidthCurrentPosition,0])
        greenValue = int(imageArray[imageHeightCurrentPosition,imageWidthCurrentPosition,1])
        blueValue = int(imageArray[imageHeightCurrentPosition,imageWidthCurrentPosition,2])

        # Gray scale average is the average of the three colors RGB
        grayValue = np.uint8((redValue + greenValue + blueValue)/3)
        # Add the gray scale value to our list
        imageRowList.append(grayValue)
        # Move to the next column
        imageWidthCurrentPosition += 1

    # finally we store the generated list into the imageArray
    imageArrayGrayScale = np.append(imageArrayGrayScale, np.array([imageRowList]), axis=0)

    # Increment the row we are working on to move to the next
    imageHeightCurrentPosition += 1
    # Set our column position back to 0
    imageWidthCurrentPosition = 0

# Set the display size to display full image
# Using matplot to load the array into their image display function
plt.figure(figsize = (imageHeight/100,imageWidth/100))
plt.imshow(imageArrayGrayScale)

# We need to make sure matplot knows it is a black and white image
plt.gray()

# Shows the Image
plt.show()
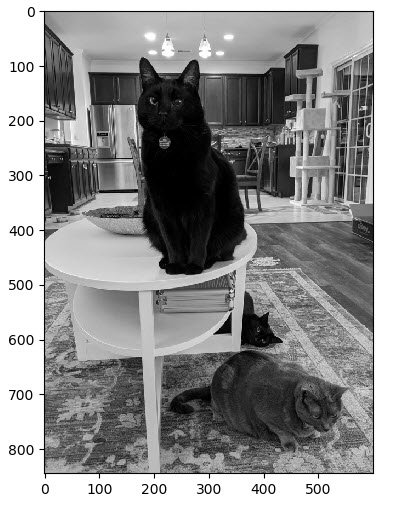
What we should get is….

See the Image Processing Table of Contents
Need a Creator Alchemist on Your Project?
I’m available for hire—consulting, systems design, embedded tech, creative problem-solving, or anything in between.
If you’ve got a project that needs someone who can think it through and build it out, I’m interested.
👉 Let’s Talk
jamie@jamiestarling.com
